To professionals in other business areas and industries, user experience or UX is still a relatively new concept. Because of this, UX is still widely misunderstood, resulting in many people not really understanding the benefits it brings to users, the product or service, and the business as a whole.
You will often hear companies say that they want to become ‘data-driven.’ So there is clearly an appetite to get insights about users, their behaviour, and their needs. But when it comes down to it, the focus is often more on what can be delivered – in the least amount of time as possible.
Take this and combine with what is typically senior stakeholders’ opinions about the future of the product or design. And you may well find that UX is a hard sell. So what can you do to make UX measurable and understood in an organisation?
1 Engage stakeholders early on
In week 1, speak to your immediate team. If you feel comfortable approaching the Head of the Department, ask if they can introduce you to key people in the organisation, such as Product Managers, Business Strategists, and Customer Experience Researchers and Designers.
Get to know your UX and Product teams. Find out where the product or service is headed for in the short term (i.e. the next 6, 12, and 18 months) as well as in the long term. Be sure to task the teams about their interests, too. This will help you to better engage with them and get your project off to a good start.
Sometimes, this is easier done over lunch or tea. Sitting down for a quick bite to eat together creates a less formal kind of environment and people tend to be more forthcoming with their opinions and ideas for products and services.

If there are a lot of key stakeholders in an organisation, I like to write down who I spoke to as well as the highlights and key takeaways of what we covered. Those notes help me to remember new names and keep track of what we agreed upon down the line.
2 Arm yourself with data
Gather what insights you already have about the product or service in hand as well as the problem you are trying to solve. As a contractor or freelance UX researcher, you may have to do some digging around the archives to find this information. But it’s definitely worth doing as it will help you build empathy with the users and understand the direction of the product.
It is always worth gathering quantitative data if you can. Regardless of the particular research project or the stage within the product or service lifecycle.
Let’s say someone has told you that the signup experience is poor and should be changed. One of the first tasks in hand should be to look at the existing quantitative data, usually held in an analytics tool, and to see if this really is a problem. If you were to notice a decrease in signups, you could run a quick, remote usability study against the competitor flows to create assumptions or hypotheses as to the possible causes.
Keep in mind that even if someone says there is no time for research, there is almost always time to conduct a quick, remote benchmark study: for one thing, there are many remote user testing tools out there that you can use to get results back fast. Depending on the type of study and target user, this is often possible in as little as 24 hours. Additionally, you can often send user research invitations to your existing panel of users. Meaning you’ll get fast results that are actually representative of your target users. So there really is no excuse not to do research.
Finally, review the initial information you managed to collect and study the results of your remote test. Armed with this data, you’re now ready to meet with key people and reap the benefits of your hard prep work: first off, your knowledge of internal matters will wow your audience. Secondly, it will help you to draft a well-thought-out research plan.
3 Put your numbers into context
It is a common misconception that UX research, especially qualitative research that considers smaller sample sizes, takes a long time and is not measurable. Therefore, it must be pointless. To understand this conclusion, you have to realise that outside of the field, there are many people who have never worked with UX Designers and Researchers before. So it is your job to show these people exactly how UX can benefit the Product teams as well as the entire business you’re working for.
As you and I know, there are, in fact, many metrics we can use in UX research. So brainstorm these with your stakeholders. Discuss the different possibilities and agree on the ones you want to use in your study.
Choose one metric to begin with. Perhaps one you can add a figure to, seeing as a lot of people respond positively to numbers. Take, for example, the number of pain points per user and showcase this data in a visual format.
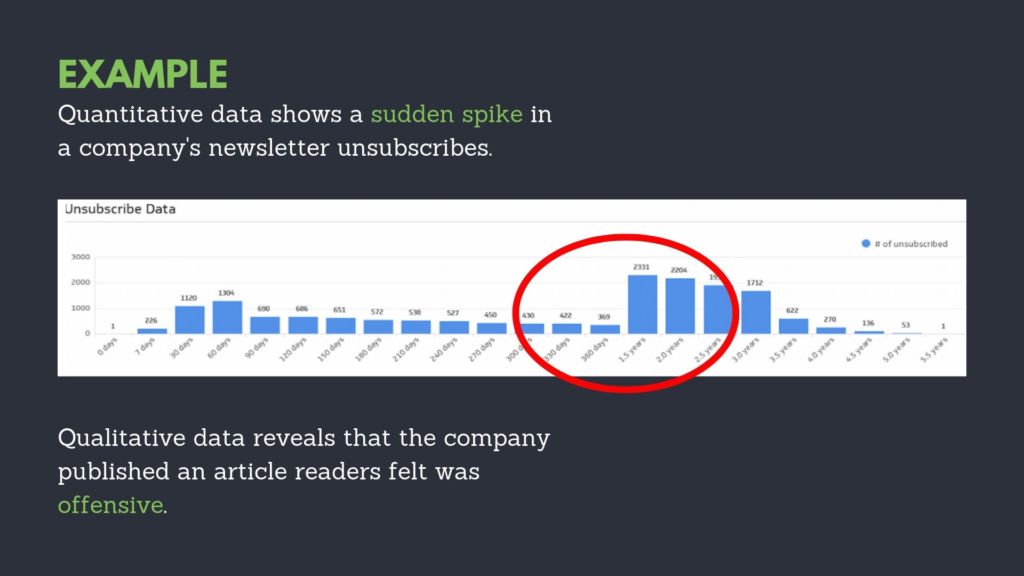
Since quantitative data is a great way to measure but not to explain a phenomenon, make sure to add some qualitative data, too. For example, quantitative research will show you a decrease in completed tasks. But only qualitative research will allow you to gain insight into the reasons behind that decrease.

Both quantitative and qualitative user research methodologies have their rightful places throughout the whole product or service lifecycle. So don’t be put off by people who say that they only trust numbers. As a UX professional, you know how important context is.
4 Spice up your deliverables
Depending on the research objectives as well as on what stage of the product or service lifecycle you are working on, you can expect to deliver a wide variety of outputs. Let’s assume you are conducting a discovery piece of work. In this case, you may want to consider presenting your insights in the form of personas, a list of user needs, and a user storyboard.
Consider printing the personas out – the bigger, the better! Why not print A3 copies and display them around the office? That way, everyone can easily become familiar with them.
Be careful about naming your personas. It is often better to add a tagline to a name such as “Last-minute Linda” or “Talks-a-lot Terry.” The reason is that people tend to unconsciously develop a preference for some personas over others if they know and like someone who happens to have the same name.
For a Beta or Live study, however, screenshots to show how the design or prototype developed may be more appropriate. Again, I advise you print these screens out before your analysis session and get everyone who observed the study involved.
Be sure to keep track of which screens were tested. That way, you have an archive in case you cannot access these screens at a later date. This could happen, for example, if website updates have been made and gone live.
In my experience, stakeholders love to see visuals. Visuals bring UX research and design to life and are thus more effective than written reports. So try to incorporate some type of visuals into all of your deliverables.
5 Think in terms of money
I recently attended a course about measuring the impact of UX. For me, one of the key takeaways was to use Monopoly-style money to quantify and visualise the success of UX research activities.
You can do this by identifying the user goals in the product you are testing. Take, for example, a media company. Goal 1) Add a celebrity to your favourites. Goal 2) Download a programme to watch. Now, put a cost against these activities, lets say £1 each time a user adds a celebrity to their favourites and £2 each time a user downloads a programme to watch. Now, back in the organisation, there is a disagreement between Marketing and Product. Marketing strongly believes that users should be able to add a celebrity to their favourites whereas Product believes that users would prefer to download a programme to watch.
So now you have two different proposals for new features. Where do you go from there? One way to approach this situation would be to choose the feature with the potential to drive more revenue (and improve the user experience, assuming the feature promotes a key user goal). In this case, the team would work on downloading a programme to watch next as this is more valuable in terms of money.
Using pretend money to force people to think about revenue can be a highly effective way to measure the impact of UX. Departments such as Finance or Sales are usually more likely to respond to hard numbers than to quotes from user interviews or trends in usability studies.
6 Stand up for yourself
It can be daunting at first to challenge senior stakeholders’ opinions. Especially if you are new to a company and/or industry or if you are just starting your UX career. However, it is important to remember that opinions without data are subjective. They are based on personal beliefs rather than facts. So you needn’t agree with someone just because of their experience or position. Furthermore, your internal stakeholders can be too close to the product – without belonging to your target users.

To sum up, you need to get all of your stakeholders involved and excited about UX from the beginning. You need to extract as much information as possible about the problem at hand by conducting both quantitative and qualitative research. The resulting data will help you avoid decisions based on subjective opinions. Finally, by including great visuals in your presentation and by establishing a clear connection to potential revenue growth, you will surely win over all of your stakeholders. But perhaps most importantly, you will surely build better products and services.

