
Table of contents
1. What are mixed methods?
2. First things first. Quantitative and qualitative data: A definition
3. The three most useful mixed method designs
4. Four steps to apply a mixed method design effectively
5. Conclusion
1. What are mixed methods?
Mixed method research is a methodology that allows researchers to use more than just one methodology to solve a problem or a set of hypotheses. More precisely it refers to the systematic integration, or “mixing” of quantitative and qualitative data within a single research project or simply alongside a set of hypotheses.
The big advantage of such an approach is, that this integration allows for a more complete and synergistic utilisation of data than the alternative of separate quantitative and qualitative data collection and analysis. In the field of UX this means that User Researchers (qualitative) and Data Scientists (quantitative) inherently complement each other and should always be considered as natural partners.
In UX projects, we experts often find ourselves in the situation of not having enough time or resources, or both at hand. Quantitative data may be readily available, but qualitative data is often time-consuming but ever so insightful.
Furthermore, we see stakeholders often wanting “the whole package” for half the time and resources. Naturally, the decision on how to manage and prioritises data in such cases can be difficult.
Through combining qualitative, empathy-driving, storytelling data with quantitative, “authoritative” and “impressive-sample” data, you have the tool at hand and the chance to get more work done in a more efficient way.
As always, many roads lead to Rome. Different stakeholders, projects, and research questions allow for different mixed-methods research designs.
In this short overview, you will find essential information on three relevant mixed-method designs and how you can benefit from applying them in your next UX research project.
2. First things first. Quantitative and qualitative data: A definition
To be able to fully understand and best use the mixed methods approach, you need to first have a solid understanding of what qualitative and quantitative data can offer you for your project and how they generally are collected.
2.1 Attitudinal vs. behavioural data
As experts in social science, we know that people do not always do what they say and say what they do.
In general, attitudinal data refers to data about self-reported information that give insights into a user’s mental model of a platform or what he thinks about a brand or certain type of product. The leading question being here, to find out what people believe or think.
Methods in attitudinal research can include:
- surveys
- user interviews
- diary study
- card sorting
In contrast, behavioural data is solely focusing on the question of what people are doing; hence, we here seek to effectively see how people are behaving in certain situations.
Methods in behavioural research can include:
- usability testing
- tree testing
- A/B testing
- web analytics
2.2 But what about quantitative & qualitative data?
In simple terms, quantitative data refers to numerical data, anything that can be counted or measured. Take task success rate, time to complete a task, or simply the number of visitors on a page. So in quantitative research, the data about the behaviour or attitudes in question is acquired indirectly through measurements or instruments such as surveys or analytical tools.
Qualitative data refers to descriptive data, here we speak of anything that can be observed but not measured- such as emotions, opinions, or motivations. This data is and should be acquired directly through observations or asked about in open-ended surveys or interviews.
Due to the nature of these two different data modalities, we can say that quantitative methods are better suited for answering questions about what and how many types of questions there are. Whereas qualitative methods are suited for answering questions about why or more importantly how to resolve a problem.
With a more profound understanding of discussed data dimensions, we can map UX research methods on two dimensions in the form of a What-Why Framework.
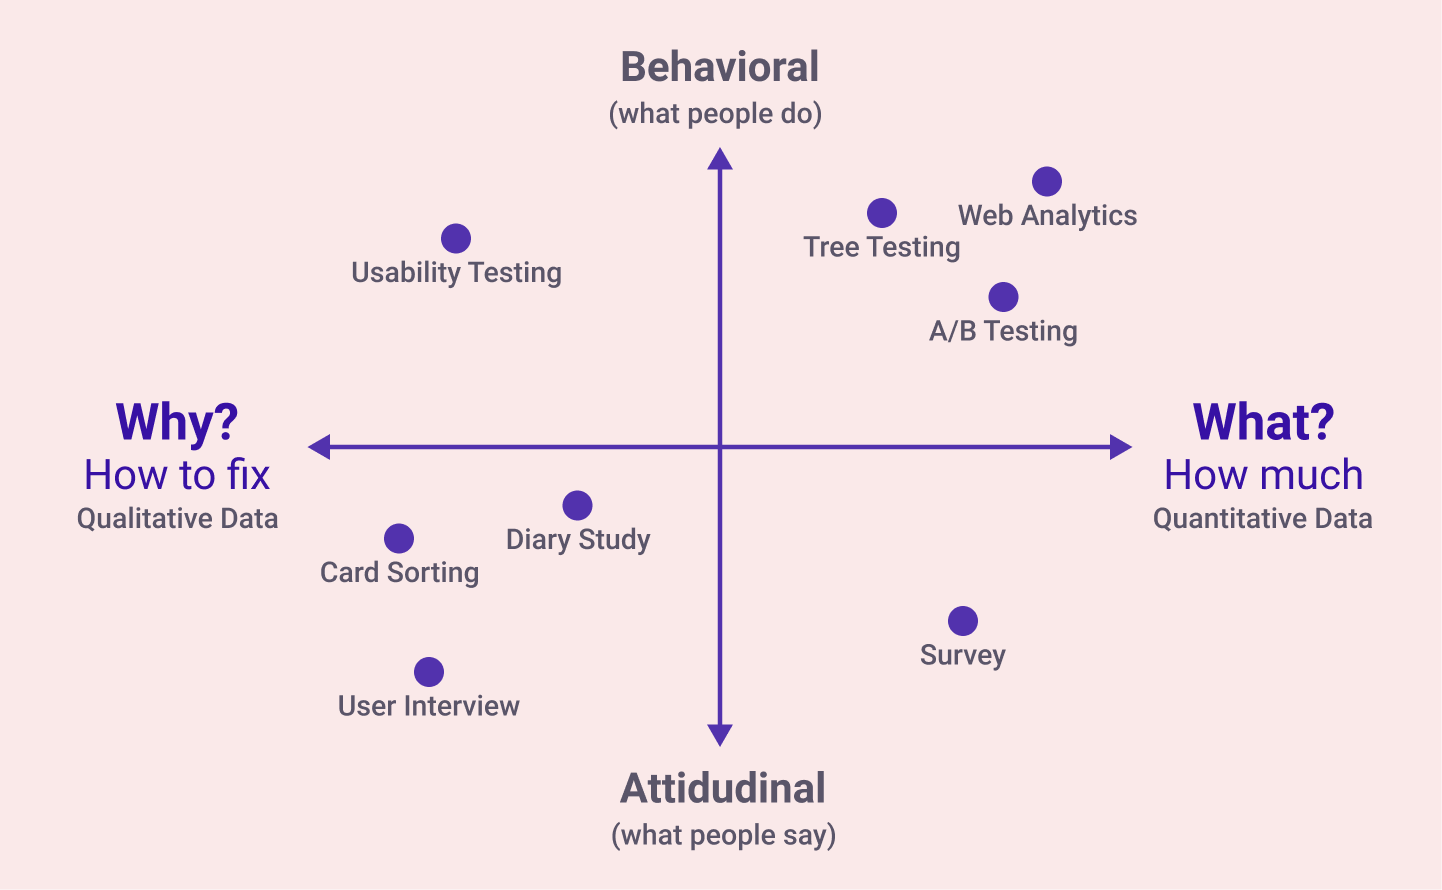
What-Why Framework: Adapted framework from Nielsen Norman Group article by Christian Rohrer.
By combining the research methods from the different quadrants of the “What-Why Framework” from above, we can gain a holistic understanding of multiple forms of data and can complement possible blind spots of single research methods.
3. The three most useful mixed method designs
Let us finally talk about the many options you have in combining the different research methods. There are three major types of mixed method designs that can be especially useful in UX research. Each comes with its special application scenario.
3.1 Triangulation design
It’s the most common and well-known approach to mixing methods. This design is being used to obtain different but complementary quantitative and qualitative data on the same research problem, to best understand the research questions. Both data types are being gathered in the same research phase.
Use this design if you want to directly compare quantitative results with qualitative findings, or if you want to validate or expand quantitative results with qualitative data.
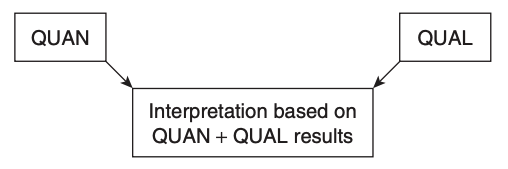
Triangulation Design by Creswell & Plano (source: Designing and Conducting Mixed Methods Research – by John W. Creswell & Vicki L. Plano Clark, 4th Edition).
3.2 Explanatory design
Unlike the first design, this design is a two-phased mixed method design. The goal of this design is that qualitative data helps to explain or build upon initial quantitative results. This design can help you to get “Why”-answers from the “What”-questions of quantitative data.
Use this design if you already have a broad set of quantitative insights from, e.g. a web analytics tool, but you cannot explain why certain features of your platform perform better or for the worse. By collecting additional qualitative data, you can follow up on identified problem areas with possible real explanations.
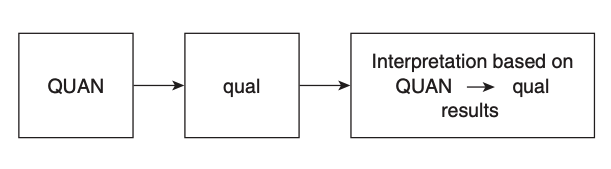
Explanatory Design by Creswell & Plano (source: Designing and Conducting Mixed Methods Research – by John W. Creswell & Vicki L. Plano Clark, 4th Edition).
3.3 Exploratory design
This design is two-phased as well. The intent in this design is that qualitative data from a first method, in example from a usability testing, can help to develop or inform you on how to gather or prioritise quantitative data tracking in a web analytics tool.
Use this design if you are not sure on how to measure or track certain user insights or performances on your website. If the metrics are unknown, or there is no guiding framework, you could rely on. By gathering qualitative insights from your test users, you have the opportunity to identify and generalise important metrics, to track quantitatively on your website in a later stage.
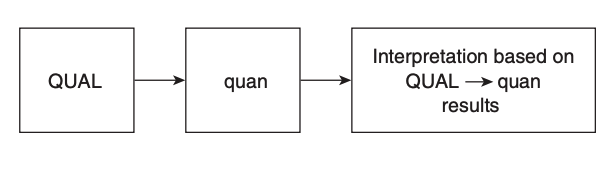
Exploratory Design by Creswell & Plano (source: Designing and Conducting Mixed Methods Research – by John W. Creswell & Vicki L. Plano Clark, 4th Edition).
4. Four steps to apply a mixed method design effectively
As we all know, things can easily get complicated and confusing in a real life situation and setting, and the organisation of resources and expertises in a team can sometimes be challenging by itself.
To better help you to prioritise and plan out a future research project and to get the most comprehensive insights out of it, there are four questions you should have always answered, before kicking off a new project.
4.1 Take your time with your research questions
Don’t jump to conclusions too fast by asking convenient or obvious questions. By clearly defining your research intent and goals, you make it easier to identify internal opportunities for collaboration, resources and blind spots.
4.2 Gather and map internal expertises and data
Clear research objectives help you to localise internal expertises and responsibilities. What data is available? What data is missing? By knowing what is missing and what is needed, it’s easier to choose fitting methods to complete your research setting.
4.3 Mix methods in the different quadrants of the “What-Why Framework”
By mixing the methods in the different quadrants of the discussed “What-Why Framework”, you can counterbalance the strengths and weaknesses of each method. Find the complementary methods, which suit your data basis and hypotheses best.
4.4 Choose a fitting mixed method design
Depending on your research goals, choose a mixed method design. By knowing the intent, procedures, and strength and challenges associated with each design, you are best set to generate valuable and holistic insights out of your research problems.
5. Conclusion
Mixed method research came a long way in the field of UX and is a powerful tool to smooth out data discrepancies and generate comprehensive and verified findings. It is crucial, especially in UX Research, to not only look at your users through the lens of one dimension (quantitative or qualitative) but to generate and complement insights out of both.
By using mixed method designs, we described how you can optimise your research processes, expertises, and resources to successfully tackle complex research questions. Please don’t hesitate to use our proposed 4-step strategy in applying a mixed method design in your next UX research project, and experiment with mixing different methods, to see what works best in your case. Happy testing!