
Table of Contents
1. What is the NPS?
1.1. The NPS can produce confusing results
2. What the NPS really tells you
2.1. The Question
2.2. The Rating Scale
2.3. The Follow-Up Question
3. Tweaking the NPS
3.1. My boss still wants to use the original NPS. What can I do?
3.2. Choose the method that works for you
The NPS or Net Promoter Score is a controversial topic. While a lot of companies claim that the NPS has given them insights into their customers and helped their business grow, others have claimed it doesn’t reflect their customers’ opinions or behavior.
This article breaks down what the NPS tells you, what it doesn’t, and what alternatives and tweaks you can use to better meet your needs.
1. What is the NPS?
The NPS is marketed as an easy-to-use customer experience measure that predicts the growth of a business. The measure asks customers a single question:
How likely is it that you would recommend [insert brand] to a friend or colleague?
The rating scale goes from 0 (Not at all likely) to 10 (Extremely likely) with 5 being a neutral rating.
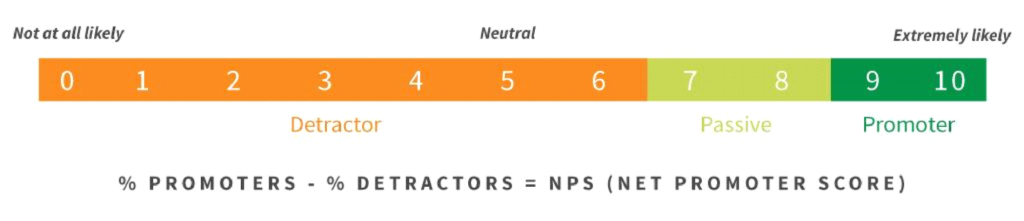
This rating scale places each customer into one of the 3 groups:
- promoters (loyal enthusiasts),
- passives (satisfied but unenthusiastic customers), or
- detractors (unhappy customers).
The NPS is then calculated by deducting the percentage of detractors from the percentage of promoters (the passives are not included in the calculation) and the resulting NPS number is used to predict your business’ growth.
1.1. The NPS can produce confusing results
We added the NPS question into one of our surveys to our French customers and the results were, well, confusing. Our NPS was below average, showing that we had more customers who were detractors than promoters. In other words, most of our customers were unhappy with our product and this could impede our growth.
But the rest of the results from the survey and feedback from our customer management and support teams showed our customers were overall happy with our product, suggesting that the NPS number didn’t reflect our customer experience.
So why did we have this low NPS number? Most of our customers gave our product a 7 or 8 out of 10 which, in France, is considered a good review. But on the NPS scale, it is considered a ‘passive’ rating. This means that the majority of our customers’ ratings were not included in the calculation and our NPS result was based on the minority 0 to 6 and 9 & 10 ratings.

I decided to do some digging. What did other UX researchers at other companies think about their NPS results? Had they experienced similar issues? I came across an insightful article by Jared M. Spool explaining why we should be cautious when using the NPS:
Net Promoter Score Considered Harmful (and What UX Professionals Can Do About It)
My main takeaways can be found below.
2. What the NPS really tells you
2.1. The Question
The NPS states that customers who are extremely likely to recommend the product, i.e. have given a rating of 9 or 10, are loyal and enthusiastic customers. There are two problems with how this is interpreted.
Firstly, the question is asking the customer how likely they will do something, not if they have done something. Secondly, the question links the likelihood of recommending the product to how satisfied customers are. But it doesn’t clarify how the two are linked, measured, or analyzed.
The question isn’t asking about past behavior or how satisfied customers are with the product. Instead, it asks a question about an event that has not happened and may never happen, regardless of the rating given. This means that the data acquired is not behavioral data that can be used. This is also known as the garbage-in-garbage-out concept.
? Read more about the garbage-in-garbage-out concept for UX research.
Now I have a question for you. What would you prefer to know?
- Whether your customers will recommend your product
or
- whether they have recommended your product?
2.2. The Rating Scale
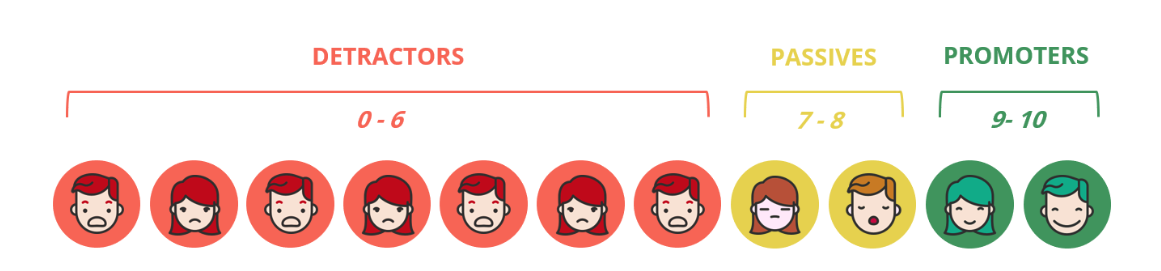
As mentioned above, the NPS rating scale goes from 0 to 10 with 5 being the ‘neutral’ midpoint rating. A balanced scale, i.e. a scale with a range of positive and negative options placed equally on either side of the midpoint, is one way to avoid potentially biasing responses. But the NPS scale isn’t balanced. Just look at how the detractors, passives, and promoters are grouped:
Customers also have no way of knowing what the numbers on the scale refer to. That is unless they specifically search for how the NPS is calculated. Therefore, the results are likely biased.
But that’s not the only problem with this scale. As we saw with our French customers, numbers are easy to misinterpret. Especially when they are on such a long scale. For example, there is a bigger distinction between a 6 & 9 compared to 0 & 6, even though the length of digits between a 0 & 6 is larger. It also makes it difficult for us to understand why customers choose a 5 over a 6 or a 6 over a 7.
There have been suggestions on how to make the NPS scale clearer, such as adding the three labels ‘Not at all likely,’ ‘Neutral,’ and ‘Extremely likely’ to the scale, or adding emojis to represent the three different groups – 7 negative emojis to represent demoters, 2 neutral emojis to represent passives, and 2 positive emojis to represent promoters. But none of these suggestions solve the bias issue, are still difficult to interpret, and can reduce the quality of your data.
? Read more about why optimal scale labels matter.
2.3. The Follow-Up Question
Now for some good news. The NPS does come with an open-ended follow-up question, which asks customers ‘Why?’ they gave that rating. The responses are written in the customers’ own words and provide the most important feedback about what is right or wrong with your product or what needs to be changed.
But not every company uses the NPS follow-up question, usually because they feel having a number is enough. This is unfortunate because it is these open-ended questions that provide insights and clarity to what you can do to improve your product.
? Read more about customizing the NPS follow-up question.
3. Tweaking the NPS
The issues around the NPS may seem complex. But there are alternatives that will help you get the results you need. Try making these four simple changes to your survey:
- Ask questions about past behavior, not possible future behavior.
- Use smaller scales (e.g. 3- or 5-point scales) to make the choice easy.
- Add in clear words for your scales, not numbers.
- Always include open-ended follow-up questions.
I listed open-ended questions last because I want to give you a couple more tips here.
Open-ended follow-up questions are a great way to know why customers give a certain rating. But instead of having one question, we can break it down into different parts:
- what customers like,
- what they don’t like,
- what can be improved, and
- what they find confusing or feel is missing.
By focussing on these areas, we can come across interesting findings. For instance, what customers liked even if they gave a negative rating. Or what they think could be improved even when they give a positive rating.
3.1. My boss still wants to use the original NPS. What can I do?
If you have had similar bad experiences with the NPS but you have to use it anyways in your research, don’t worry! We were faced with the same issue and tackled it by showing our stakeholders that there are better methods.
We tried out an alternative question to the NPS on our French customers, a variation of two questions that Netflix had asked their customers:
In the last 6 weeks, did you recommend
us to a friend or family member?
Yes No
As a new subscriber, were you recommended
to us by a friend or family member?
Yes No
We compared our results from our alternative question with the previous NPS result and found that the alternative question gave us a clearer insight into our users’ behavior, represented our customers, and tied in with our product data and feedback.
After presenting the issues we had with the NPS to our stakeholders and showing the results of our alternative question, we dropped the NPS from our UX research surveys, refined our rating scale questions, and followed them up with open-ended questions to look deeper into our customers’ behavior. This is one solution.
Another solution could be to include both the NPS and an alternative question about past behavior, give your question a smaller scale with clearly worded labels, and add follow-up questions in the same survey. You can then compare the results to see if the NPS compliments the rest of your results and possibly see if it ties in with your company’s growth.
If it does, then you can have the best of both worlds – a working NPS that relates to your other results. If it doesn’t, then you have a strong case to drop the NPS question from your survey.
3.2. Choose the method that works for you
I’d like to give you a final piece of advice at this point. When it comes to gathering feedback from customers, nothing is foolproof because your customers’ answers are subjective. Knowing how to gather good quality data and how you can use customer behavior results to make your product a success comes with experience, testing, and looking for ways to improve your research methods.
So don’t choose a method because someone else says it worked for their product. Choose the method that works for yours.