
Nowadays, there is a variety of tools that are quick to set up and easy to use for measuring a wide range of UX metrics, completely automatically and 24/7. In addition, basic versions of some of these tools are even free. Rather than ‘Why should you measure?’, the question should be ‘Why haven’t you started measuring yet?’
If you still haven’t thought about which metrics or UX KPIs (key performance indicators) you’d like to measure, you may want to read the following article: The 7 most important UX KPIs and how you can measure them.
The six UX measuring tools
Depending on what you’d like to measure (and achieve), you may need a different tool. Some of these ‘tools’ only focus on a single task; others – such as Hotjar – shine in several disciplines. There are now hundreds of UX measurement tools on the market, and new ones are appearing every month. It’s tough even for advanced users to keep up with everything that’s going on and to choose the right tool. But don’t panic! We&’re happy to make things simpler for you. You can find our selection of the best-known, most important and highly regarded tools below:
| Feature/tool | Hotjar | Google Analytics | Delighted | Optimizely | Survey Monkey | User Zoom |
| User Analytics | ✓ | ✓ | ||||
| Heatmaps | ✓ | ✓ | ||||
| Surveys | ✓ | ✓ | ✓ | |||
| Customer feedback | ✓ | ✓ | ✓ | ✓ | ||
| A/B testing | ✓ | ✓ | ||||
| Website recordings | ✓ | ✓ | ||||
| Funnel conversion | ✓ | ✓ | ✓ | |||
| Price per month from | €25 | Free | € 20 | On request | € 28 | On request |
1. Hotjar
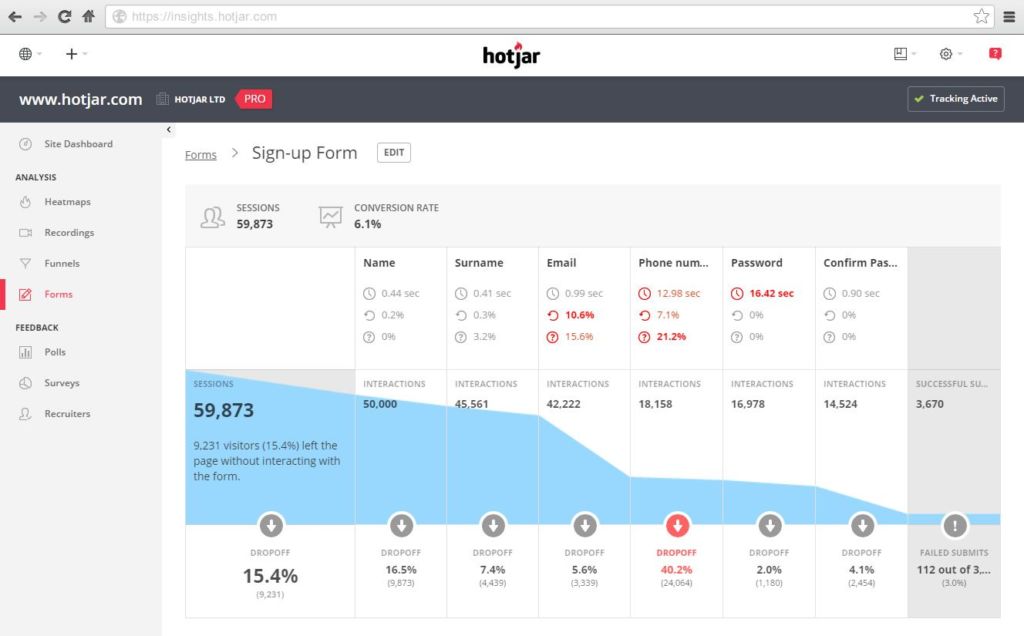
Hotjar is probably the easiest tool to use for measuring website data and collecting user feedback. Among experts, it is also known as the ‘Swiss pocket watch’ of user experience tools. The software comprises the following functions:
- Website recordings
- Heatmaps
- Conversion funnels
- Feedback polls
- On-site user surveys
Hotjar is also ideal for identifying so-called ‘bottlenecks’ (or funnels) on your website. On a page where many users drop out, for instance, you could ask users why they don’t complete the purchasing process. In terms of value for money, Hotjar is streets ahead (from EUR 25 per month). You can also try out the tool for 15 days free of charge (as of April 2018). How Hotjar works:
Read this article for an excellent description of the best way to get started with using Hotjar for measuring purposes. Alternatives to Hotjar
2. Google Analytics
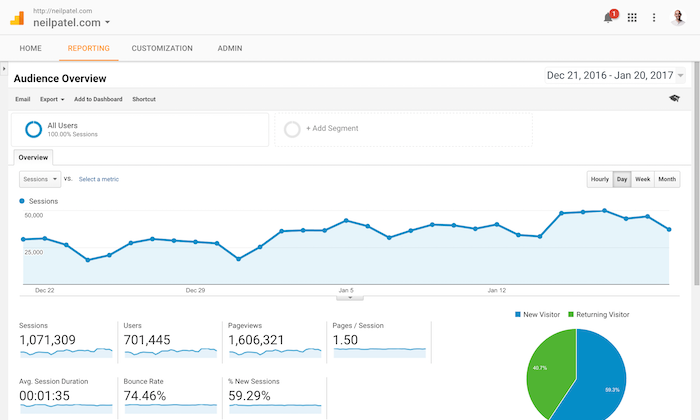
Google Analytics is a very frequently used measurement tool for analysing user behaviour on your page. The standard version – which is usually enough even for large businesses &– is available free of charge and can be set up quickly and easily. These are the most important functions:
- Tracking qualitative and quantitative user behaviour
- Conversion tracking and experiments
- Number of visitor details (language, origin, demographics)
- Behaviour flow
- Organic and paid (AdWords) Google search keywords that users use to reach the page
You can find more details on the relevant functions here. The following video will show you what the Google Analytics user interface looks like and everything you can do with the tool:
Alternatives to Google Analytics:
3. Delighted
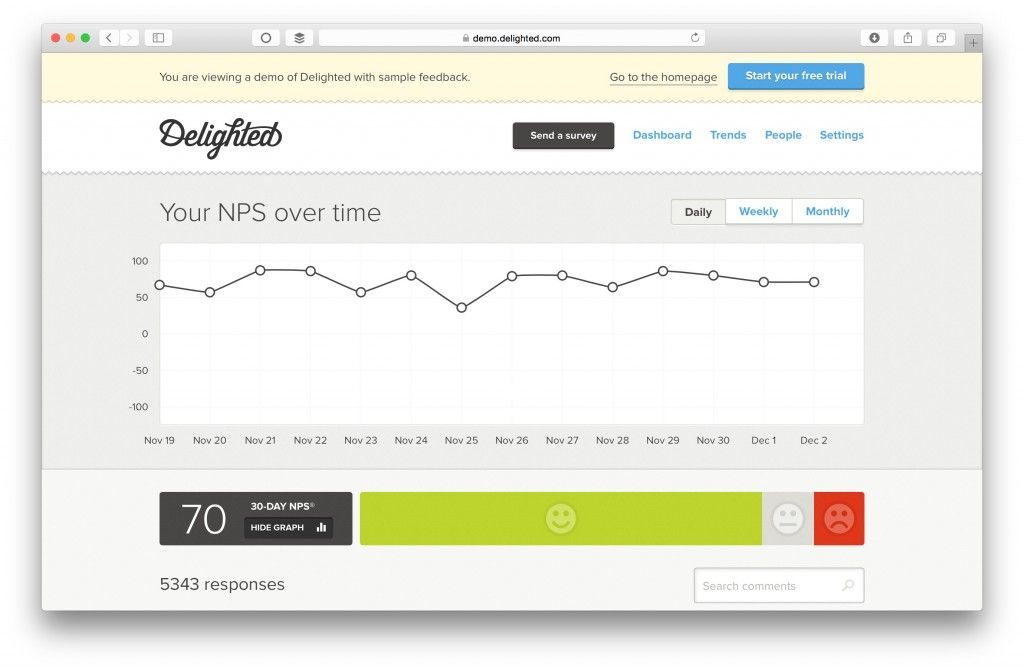
With Delighted, you can measure and evaluate the following qualitative (or attitude-based) metrics easily:
- NPS (Net Promoter Score)
- CSAT (Customer Satisfaction)
- CES (Customer Effort Score)
- 5-star customer feedback ratings for your product or service
The surveys can be carried out via the following channels according to taste:
- Text message
- Website
Once the data is collected, the information is prepared and displayed for you in a clear dashboard. Delighted has a comparatively high response rate thanks to its intuitive and appealing interface for respondents. Find out more details about how Delighted works here. Check out a live demo here. Alternatives to Delighted:
4. Optimizely
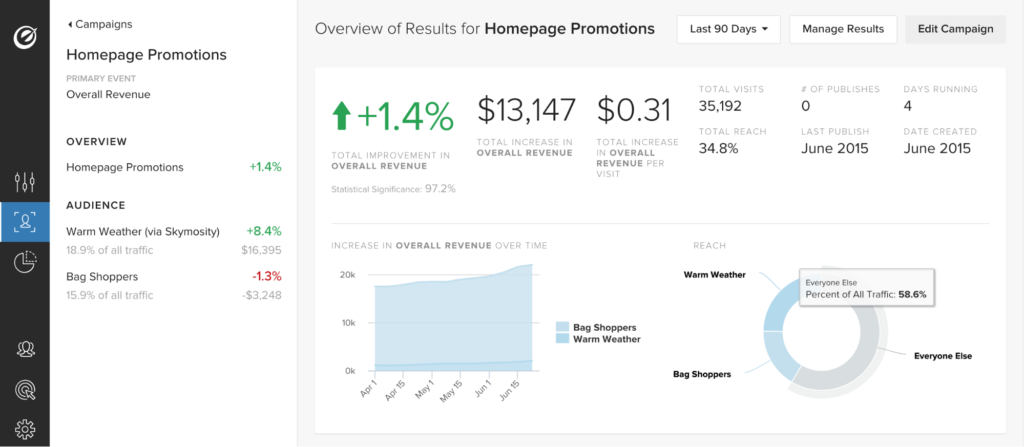
Optimizely is the best-known tool for A/B testing (also known as split testing) on the market and helps you find out which version of your website is the most successful or profitable. In many cases, small changes in the image selection or a call to action text are enough to bring about dramatically higher conversion rates. Particularly at the beginning, when less work has been put into optimising conversion. Optimizely is quick and easy to install with a code and offers an easy-to-use user interface which makes the complex matter of A/B testing manageable, even for beginners. The following video has more details on how A/B testing and Optimizely work:
As well as A/B testing, in which only two versions of a page are compared, you can also conduct so-called multivariate tests with Optimizely. The aim of the latter is to find out which combination of versions leads to the best result. Alternatives to Optimizely:
5. SurveyMonkey
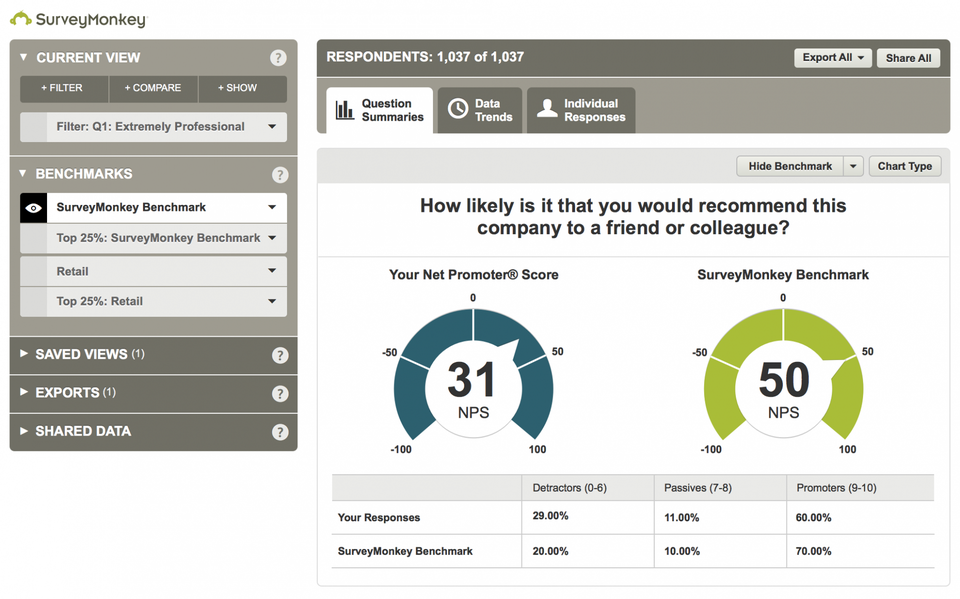
SurveyMonkey is a veteran in the online surveys sector and lets you set up, send and evaluate surveys quickly and easily. Depending on the type and scope of your membership, the tool offers a range of survey templates so you don’t have to design every survey from scratch, including:
- Employee satisfaction surveys
- Net Promoter® Score
- Market research surveys
- Marketing surveys
- etc.
For a (significant) extra charge, you can also benchmark the performance of your organisation (or your tests/survey) against those of others in your industry.
Alternatives to SurveyMonkey:
6. UserZoom
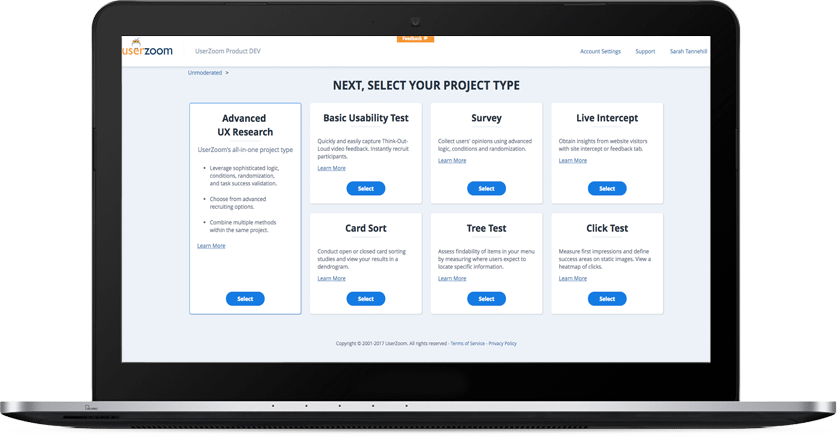
UserZoom is an all-in-one tool. In return, however, you are also offered a great deal (all combined on a single platform). These are the most important functions:
- Usability testing
- Online surveys
- User feedback monitoring
- Card sorting
- Tree tests
- Click tests
- Timeout tests
All in all, UserZoom is a strong and versatile tool for the more advanced user. For beginners, it may sometimes be better to start with less extensive (and cheaper) tools. You can find more details on UserZoom in the following video:
Alternatives to UserZoom:
What should you measure… and which tool should you use?
Now you know the most important UX measurement tools on the market, there’s probably one big question that’s still unanswered: Which metrics/KPIs should you measure? Only once this key question is answered can you select an appropriate tool and start measuring. This is often where errors creep in. If you don’t take care, you might end up measuring the wrong thing. For example, a million website users each month for your e-commerce store may be quite impressive. Yet as a mere metric, not in correlation to the number of conversions/sales, for example, this says very little. The right KPIs and metrics are those which help you improve your business’s &’bottom line’ and achieve your targets at the end of the day.
Defining the right KPIs for an organisation, department or project is a science and discipline in itself. But don’t panic! Our TestingTime guide Make UX measurable and strengthen your company’s UX culture has everything you need to watch out for, explained easily and clearly. You can find a complete guide on ‘How to perform an in-house usability test’ here.
Don’t overload yourself: Despite the many benefits of UX measurement, you don’t need to go from 0 to 100 in three seconds, metaphorically speaking, and set up five different tools on your first day. It&’s better to focus on a few metrics and tools and – particularly at the beginning – keep an eye on everything at first. Which KPIs you can measure using which of the above tools is listed in the following table:
Pro tip: Before you decide on a tool and start measuring, you should check first of all whether your marketing department or website manager (for instance) already uses one of these tools. Google Analytics, for example, is usually part of a business’s standard repertoire, even for small firms.
Setting up the tool and data protection provisions
It usually takes less than ten minutes to install a measurement tool such as Hotjar or Google Analytics on a website, even for the more technically challenged among us. In most cases, all you need to do is copy a code into the webpage’s header tag. You should then be able to get started with measuring straight away. This is how it works for Hotjar:
To be on the safe side legally, your website’s data protection policy should be expanded with a description of the tool being used. You can usually use those of other companies as a guide. Such as the data protection policy for the recruitment company Hays, which states that it uses Google Analytics, Hotjar and wiredminds on its page. In order to avoid being reprimanded in case of doubt, a lawyer should at least check in the medium term whether your data protection policy and legal notice are 100% compliant with rules and regulations. This is particularly important with regard to the EU GDPR (General Data Protection Regulation), which came into force in May 2018: Based on the reforms, some of which are complex, experts are expecting a wave of reprimands for many websites and companies.
Analysing the results
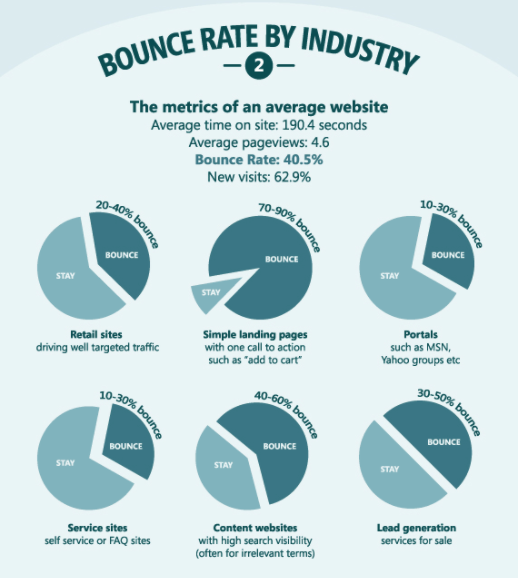
Once you’ve defined the right metrics and collected your first measurement results, you can practically benchmark against yourself and focus on getting a little better every single day. Some tools – such as SurveyMonkey – also allow you to benchmark your measurement results against other companies or websites and thus to check how you are doing in comparison to your competitors. However, you should ideally always take a complex approach to interpreting your measurement results and, as the Romans said, take them with a pinch of salt: For example, a bounce rate of 55% may be completely normal for a content website (see graphic below). By contrast, for a portal page (like Yahoo), this value would be negative.
Pro tip: Even if you want to give yourself time with analysing the results and the resulting strategic conclusions: The quicker you set up the tools, the sooner you will have a strong data set to hand which you can use to come up with measures for improvement (at any time and without waiting for data to be collected).
In summary: Are you still waiting or have you started measuring?
Unfortunately, in most businesses, UX does not yet have the status it deserves. As a potential usability ambassador, you can make it your job to inform your colleagues and supervisors of the mostly unexplored, faraway and fruitful land of UX. In doing so, you have a major advantage: Nowadays, it is easier than ever to measure UX and back up your arguments with clear and indisputable measurement data and facts. It also usually only takes a few minutes to set up the tools and start measuring.
Do you already measure UX metrics? If so, which ones? How has the acceptance of UX in your company developed since then? Not measuring yet? What’s stopping you from starting to measure? What would motivate you to give it a try?